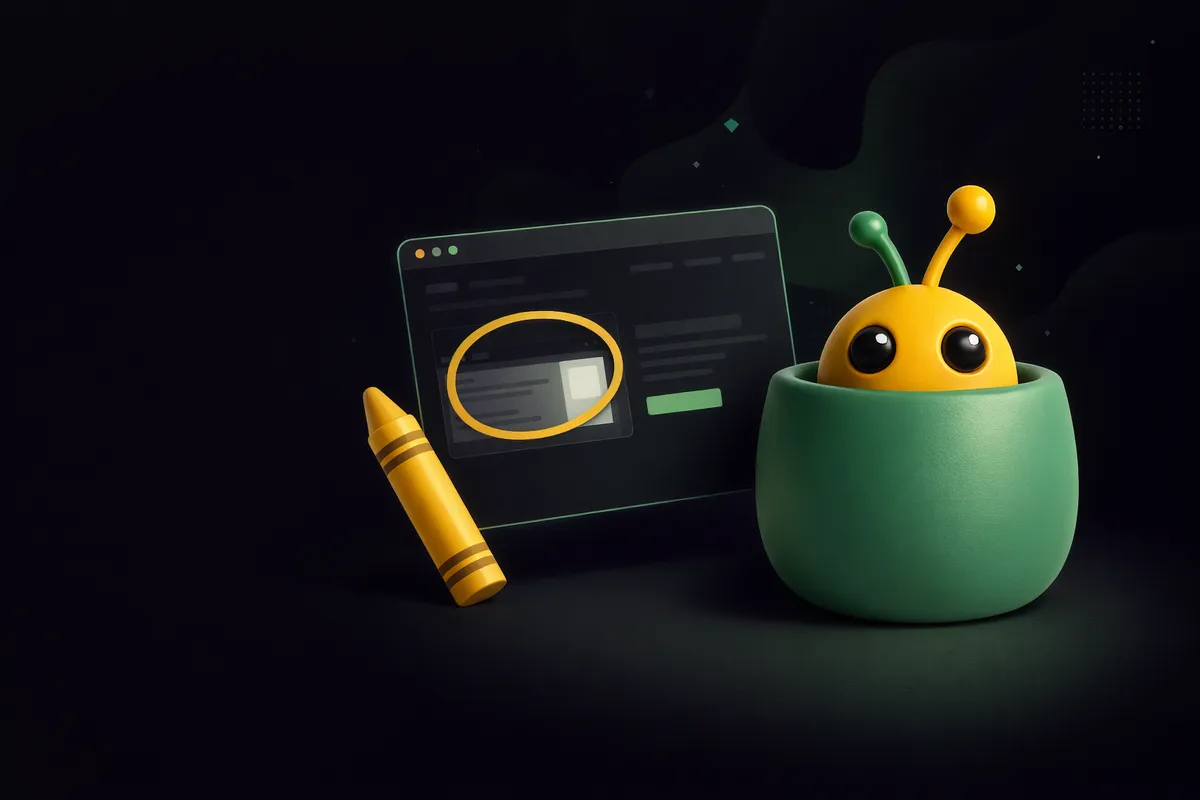

Visual feedback
A screenshot of what they saw, marked up where it broke
Every report arrives as an annotated capture of the exact page state, with the browser, operating system, viewport and console errors already attached. No more asking “which button?” over email.
Screenshot capture
Pixel-accurate captures of the live DOM
The widget takes a snapshot straight from the rendered document: every element, every style, every image the reporter actually saw. A hybrid renderer picks the best strategy for the page, and falls back gracefully when a canvas taints or an iframe refuses to co-operate.
- Full-page or visible-viewport capture, at native device pixel ratio
- Web fonts, CSS backgrounds, gradients and SVG rendered faithfully
- Automatic fallback when cross-origin images taint the canvas
- Runs entirely in the browser, nothing leaves the page before submit
Annotation
Boxes, arrows and text, right on the screenshot
Reporters point at the problem instead of describing it. Drawing tools live inside the widget, feel like a real design app, and produce marks that stay sharp whether the screenshot was captured on a 4K desktop or a phone.
- Rectangle, arrow, freehand pen and text tools
- Numbered pins that thread each comment to a specific mark
- Strokes scale with the underlying image so 4K captures stay crisp
- Undo, redo and colour picker without ever leaving the page
Pin
Anchor a note to a spot on the page.
Box
Circle the region that’s misbehaving.
Arrow
Point at what to look at first.
Text
Type directly on the screenshot.
Environment
Every browser detail you were about to ask for
You never have to ask “which browser?” again. Bugpot reads the runtime environment when the reporter opens the widget and attaches it to the issue, so the answer is already there before the ticket lands.
- Browser
- Name, engine and full version
- Operating system
- macOS, Windows, iOS, Android
- Viewport
- Width × height at capture time
- Device pixel ratio
- 1x, 2x, 3x: the whole retina story
- Page URL
- Full path, query string and hash
- Language & timezone
- Reporter locale for reproduction
After · the same report, through Bugpot
Pay button clipped below 400px viewport
Open- Browser
- Safari 18.2 · iOS 18
- Viewport
- 390 × 844 @3x
- URL
- /checkout?step=payment
- Console
- 1 error captured
Console errors
JavaScript errors, captured while they happen
The widget silently records console errors and unhandled promise rejections from the moment it loads. When a reporter submits, the full trace ships with the screenshot. No more asking them to open DevTools and read out red text.
- Console.error, console.warn and unhandled exceptions
- Full stack traces with file and line numbers
- Buffered locally, nothing sent unless the report is submitted
- Shown alongside the screenshot in the triage inbox
> TypeError: Cannot read properties of null
    at CheckoutButton.handleClick (checkout.js:184)
    at HTMLButtonElement.<anonymous> (checkout.js:71)

> Failed to fetch: POST /api/coupon
    net::ERR_INTERNET_DISCONNECTED
    at applyCoupon (coupon.js:42)
Pixel-perfect mode
For the pages that fight back
Some pages resist DOM capture: WebGL canvases, third-party iframes, protected video, exotic CSS. For those, Bugpot offers a pixel-perfect mode powered by the browser’s native getDisplayMedia API. The reporter grants a one-off screen-share, the widget snaps a single frame, and the share ends immediately.
One frame, then done
The screen share is used to grab a single image and closes automatically. Nothing is streamed anywhere.
Native browser permission
Uses the same secure API browsers already ship for video calls. The reporter picks exactly what to share.
Cross-origin friendly
Works with third-party iframes, protected media and WebGL canvases where DOM capture can’t reach.

Turn vague emails into structured bug reports
Every report arrives with a screenshot, environment data and console errors already attached.